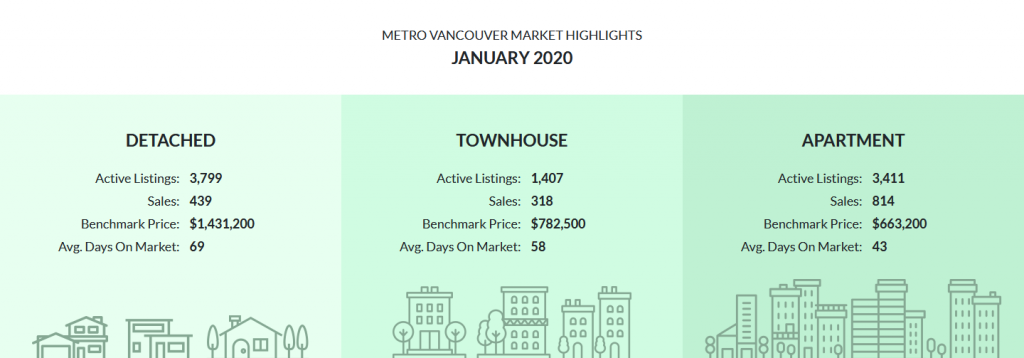

The January 2020 Market stats are out and available for download. You get the following graphs and charts for both Vancouver East and Vancouver West.
- Activity Snapshot by PropertyType
- Detached Properties Report and Graph
- Condo Report and Graph
- Townhomes Report and Graph
- Benchmark Price Graph
- Average Price Per Square Foot
If you are interested in a report like this is for other areas, please contact me to request it and I’ll send it to you.